What If Underground Pipes Aren't the Answer Anymore?
A financial case for rethinking water distribution from first principles
The short version
A mid-size water district serving 50,000 people spends $459 million over 30 years on underground pipe it can't see, can't easily inspect, and can't afford to replace. 16% of treated water leaks into the ground. The replacement math never catches up.
We modeled two alternatives. One keeps the trunk mains but adds visible, above-ground storage nodes at neighborhood scale. The other goes further, piping only potable water and handling the rest through local capture and recycling. The savings range from $117 million to $191 million per district over 30 years. Leakage drops from 16% to as low as 4-5%.
This is what happens when you redirect the capital a utility is already going to spend on pipe replacement toward a different mix of assets. The cheapest option is also the most visible and maintainable. And because tanks can operate for 50 to 100 years with proper maintenance, the residual value beyond the 30-year window is dramatically better. The full financial model is available for download at the bottom of this post.
Baseline: 50,000-person water district
Annual budget
$17M
$12M O&M + $5M capital
Distribution pipe
~300 mi
Avg age 45 yrs, 20% past useful life
Water lost to leaks
16%
~800K gal/day of treated water
Click to compare models — 30 year lifecycle
Where the money goes — 30 year cost breakdown
Cumulative cost over 30 years
Leakage: the invisible budget drain
The tank inspection market shift
Option A: tanks
2-4
Municipal storage only
Option B: tanks
12-14
+ 10 hub nodes
Option C: tanks
17-19
+ 15 hub nodes
The full analysis
I came up in water. Capital planning was always the conversation that made everyone uncomfortable. The budgets never stretched far enough. The infrastructure was always older than anyone wanted to admit. That part I knew.
What I did not know, until I spent real time on the storage side, was how dramatically distribution pipe outweighs every other capital category. It's not close. Pipe replacement dwarfs treatment upgrades, pump stations, storage, controls. It dwarfs all of them combined.
Once I saw that clearly, I could not stop asking the question: what happens if we change the equation? What if distribution pipe stops being the default and starts being one option among several?
That's what this analysis is about.
The status quo is bleeding money
Take a mid-size water district serving 50,000 people. That's a small city. A bedroom community. Nothing exotic.
That district spends roughly $17 million per year operating its water system. About $12 million goes to operations and maintenance. About $5 million goes to capital improvements. Roughly two-thirds of that capital need, about $3.3 million per year, goes to repairing and replacing underground distribution pipe.
The district has approximately 300 miles of pipe in the ground. The average pipe is 45 years old. About 20% have already exceeded their useful lives and are waiting for replacement that isn't coming. The money isn't there.
At $1 million per mile to replace a water main, the total replacement liability is $300 million. Against a capital budget of $5 million per year. That's a 60-year replacement cycle for infrastructure with a 75 to 80-year lifespan. The math doesn't close. It never catches up.
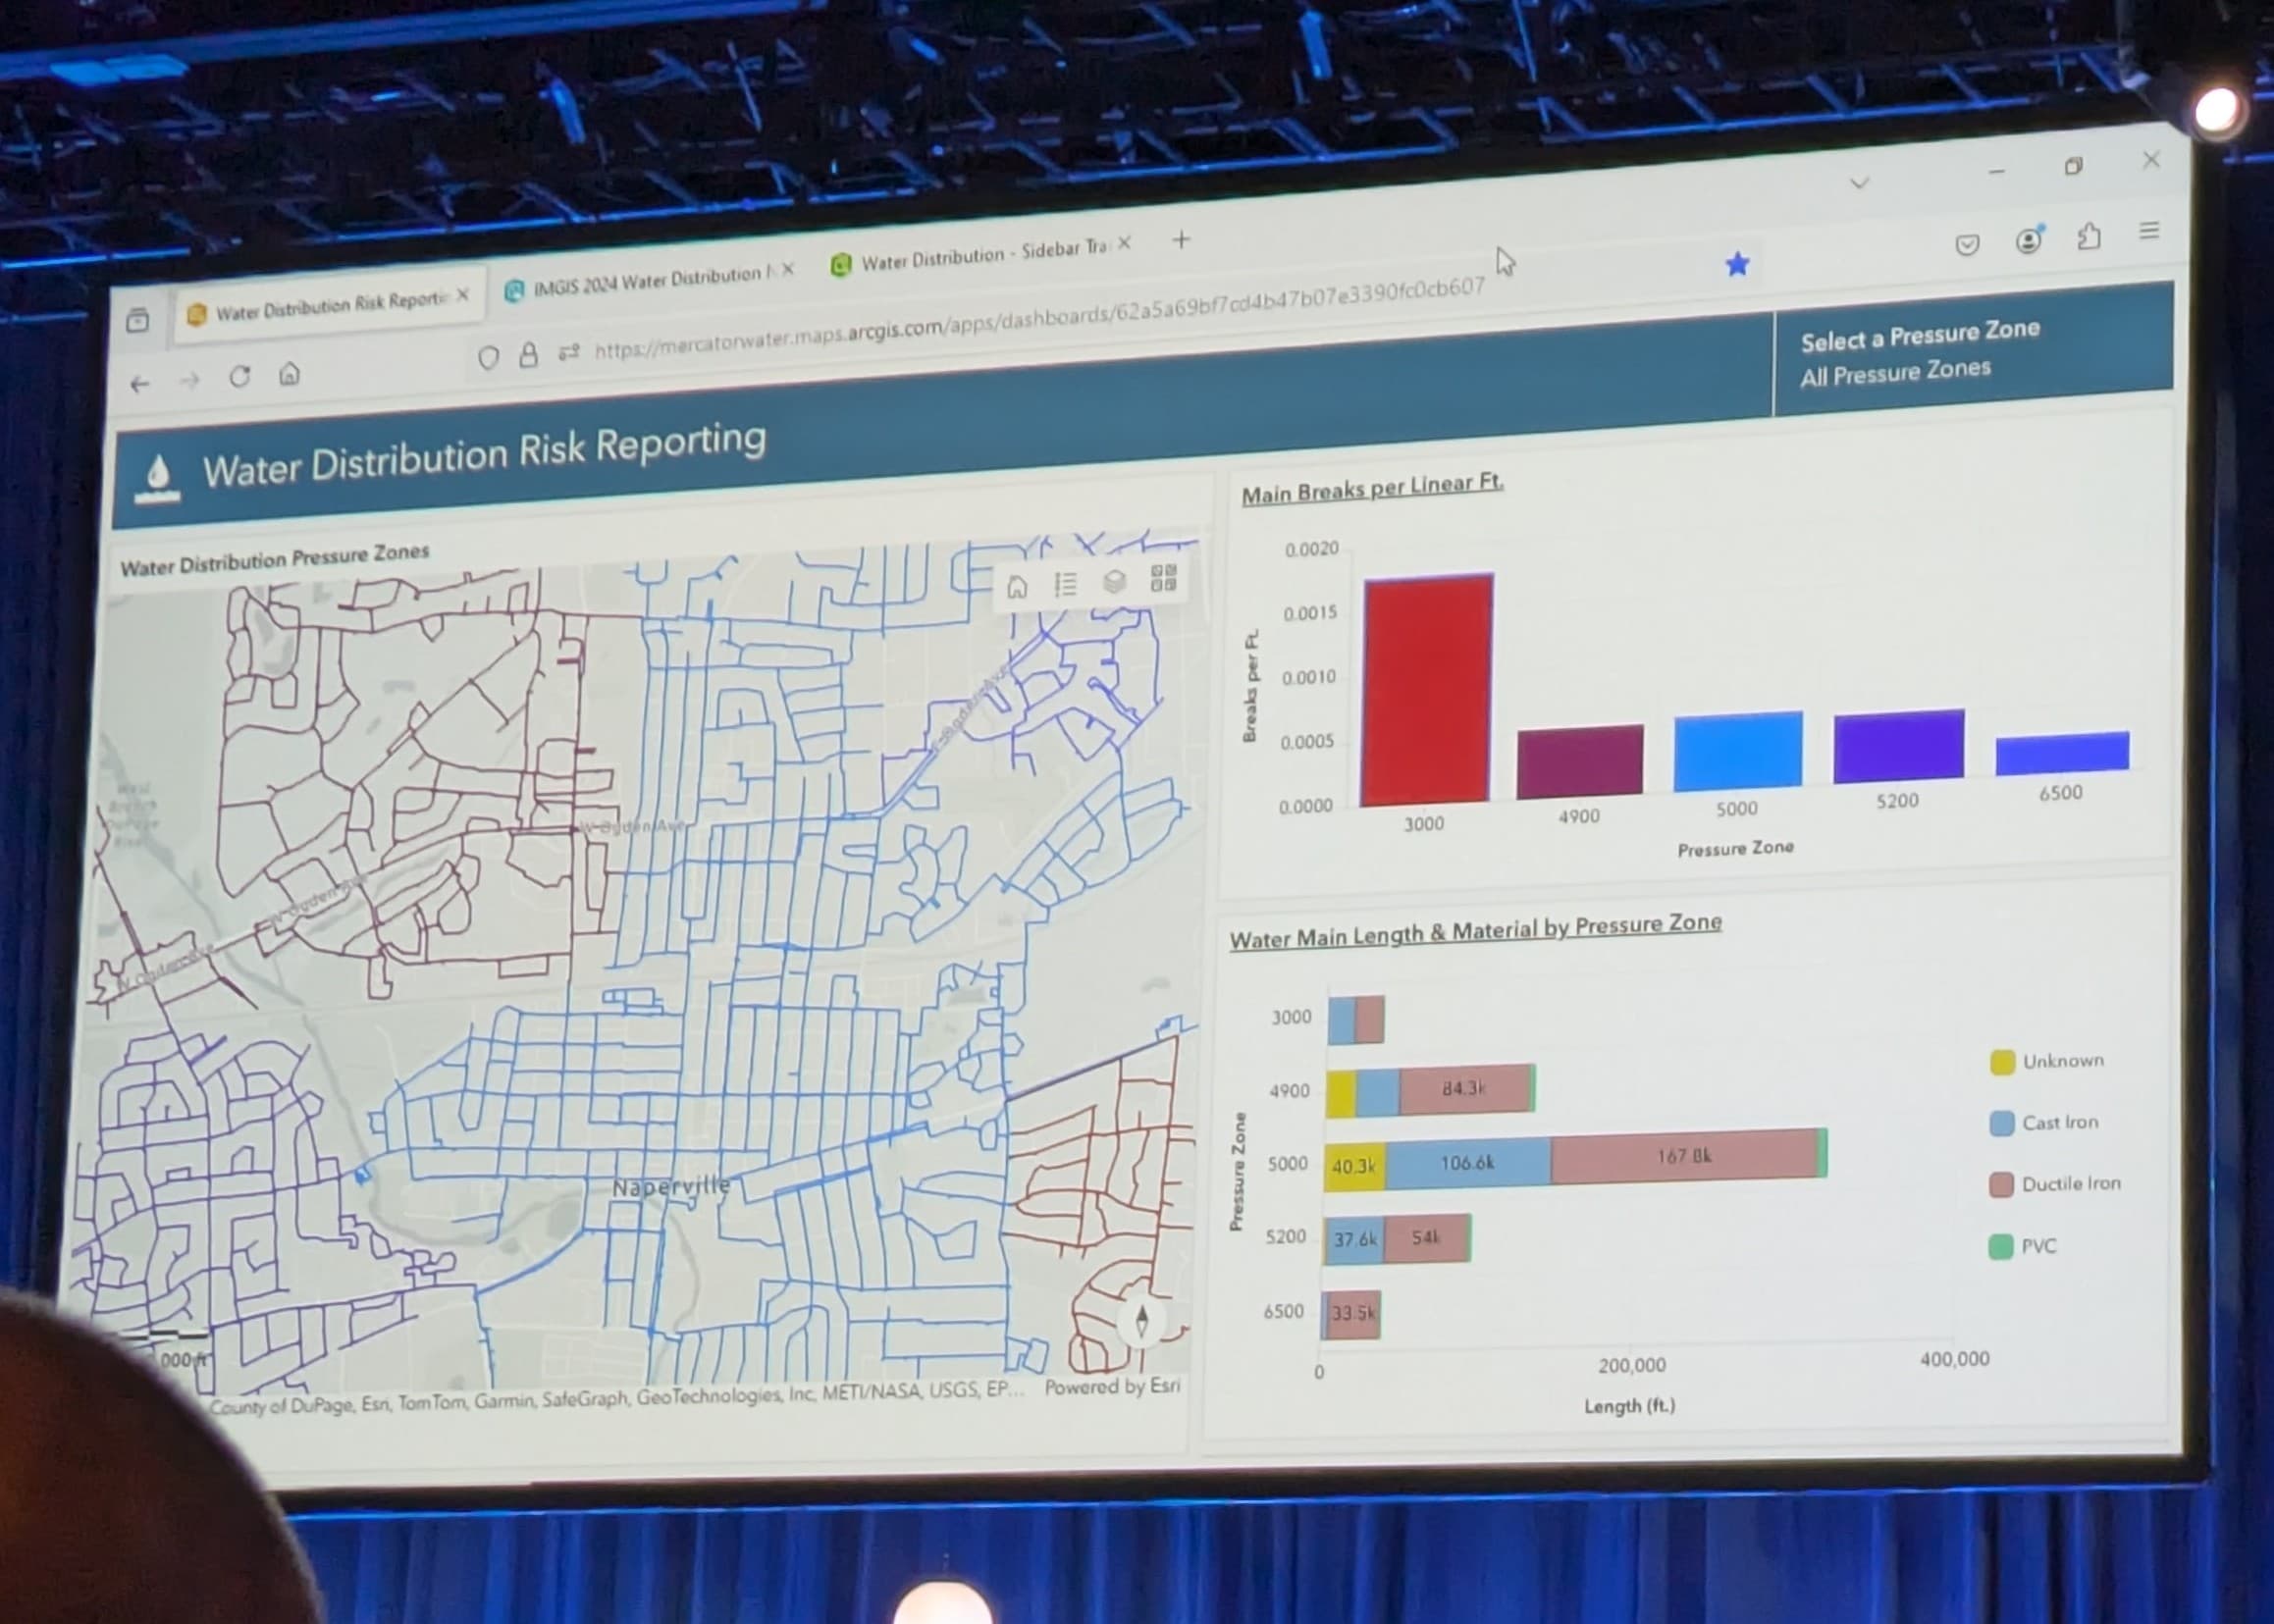
While the district waits, 16% of the water it treats, pumps, and pressurizes leaks into the ground. Never reaches a customer. That's 800,000 gallons per day. About $1.2 million per year in wasted treatment and energy costs. Over 30 years: $36 million poured into the dirt.
This isn't a funding problem. It's a design problem. We designed a distribution system that's invisible, uninspectable, and impossibly expensive to maintain. Then we act surprised that it's failing.
Where the idea came from
I did not come up with this by staring at water infrastructure. The inspiration came from watching other industries solve distribution problems in ways water never has.
Microgridding changed how I think about networks. In the last decade, electricity went from a purely centralized generation model to one where solar panels, batteries, and local storage sit at the edge of the grid. The big grid still exists. But the dependency on it is shrinking. Generation moved closer to the point of use. That pattern made me ask: why can't water storage move closer to the point of use too?
Amazon changed how I think about staging. Retail used to mean one warehouse ships everything. Amazon figured out that if you stage inventory close to demand, you reduce the cost and complexity of the last mile. That is a technology-driven distribution model. It replaced the old assumption that centralized equals efficient. When I looked at water, I saw the same old assumption sitting unchallenged. One treatment plant. One pipe network. Everything flows from the center.
Petroleum is a different animal entirely. It is heavy industry distributing a combustible liquid to power vehicles, not delivering a utility to homes. The economics are wildly different. But there is one thing petroleum got right that water got wrong. Petroleum does not pipe gasoline to your house. It trucks fuel to locally stored tanks at gas stations. The distribution is visible, inspectable, and maintainable. The energy source itself powers the delivery. Water does not have that advantage. But the principle of visible, distributed, maintainable storage points is the same.
None of these are perfect analogies. Water is heavier, cheaper per unit, and regulated differently than electricity, packages, or fuel. But the pattern across all of them is consistent. Move storage closer to demand. Make the assets visible. Reduce dependency on a single buried network that you cannot see or maintain. Water is the last major distribution system that has not asked the question.
Three models, one question
What if we designed water distribution the way we'd design it today? With everything we know about networked systems, distributed storage, and what it actually costs to maintain things?
Option A: The status quo. 300 miles of underground pipe. $459 million over 30 years. 16% leakage. You can't see 70% of your assets.
Option B: Hub and trunk. Keep the big transmission mains. Add 10 distributed storage nodes, visible above-ground tanks at neighborhood scale. Reduce the pipe network to 120 miles of shorter, newer, higher-pressure local runs. $342 million over 30 years. Leakage drops to 6%.
Option C: Hub and hybrid. Trunk mains feed 15 storage hubs. Pipe only the potable portion, roughly 30 gallons per person per day out of a total 80-100 gallons of daily use, through just 50 miles of pipe. Non-potable demand (irrigation, toilet flushing, washing, 70% of residential consumption) gets handled through local capture and greywater recycling. $268 million over 30 years. Leakage drops to 4-5%. Nobody has built this model at scale, so the exact number is unproven. But the physics are straightforward. Fewer pipe miles, newer materials, shorter runs, higher pressure. As engineers prove out hyper-hubbed networks, leakage rates could go lower still.
The gap between doing nothing and rethinking the system is $191 million for a single 50,000-person district.
What these numbers actually represent
I want to be clear about what this model is and what it is not.
Nobody is proposing that a utility tear out its entire pipe network and start over. That would be insane and nobody would fund it.
What these models represent is a redirection of capital that utilities are already going to spend. A district with 300 miles of aging pipe is going to spend $99 million over 30 years on pipe capital whether it wants to or not. That money is already spoken for. The question is whether you keep spending it on mile-for-mile pipe replacement, or whether you redirect some of that capital toward storage nodes that reduce your total pipe dependency.
In Options B and C, the capital spend actually goes down. Option B requires $72 million in capital. Option C requires $58 million. That is less than the $99 million the status quo demands. You are not adding a new line item to the budget. You are spending less total capital and getting a more maintainable system in return.
There is another piece that the 30-year window does not capture. Pipe has a useful life of roughly 75 to 80 years, and at the end of that life you have to replace it again. A well maintained steel storage tank can operate for 50 to 100 years. The tanks you build in year one of the transition are still working assets in year 50. The pipe you replace in year one is approaching end-of-life again before the tank even needs major rehabilitation. The residual value beyond the 30-year window is dramatically better for the storage-heavy models.
This is not a proposal. It is a financial comparison that asks: if you had the same capital budget and could choose how to allocate it, which approach gives you the most maintainable, visible, long-lived infrastructure for the dollar?
The physics are on our side
The usual objection is that water is heavy. A gallon weighs 8.3 pounds. The average household needs 300 gallons a day. You can't truck that.
That's true if you're trying to replace 100% of the pipe network with trucks. Nobody is proposing that.
70% of residential water use is non-potable. Toilets, irrigation, laundry. This water doesn't need to come from the treatment plant. Rainwater capture, greywater recycling, and local storage can handle that. Systems that sit on or near the property. You can see them. You can maintain them. They don't depend on the underground network.
The pipe network only needs to deliver the potable 30%. And for that 30%, shorter pipe runs from nearby storage hubs mean higher pressure, less leakage, newer materials, and easier replacement when the time comes.
We're not eliminating pipes. We're right-sizing them. Moving the balance of distribution value from invisible buried assets to visible surface assets.
This scales, but not the way you'd expect
The financial case changes depending on the size of the utility. The relationship is simple: the smaller the utility, the stronger the case.
Small utilities (10,000 people) have up to 108% more pipe per person than large ones. Their networks are sprawling and expensive. Each person is carrying $450 per year versus $260 in a million-person metro. For these small districts, switching to a distributed storage model saves 47% over 30 years. The pipe burden is so disproportionate that almost any alternative allocation of capital produces a better outcome.
Large metros (1 million+) sit at the other end. Density makes their pipe networks efficient. Per-capita costs are lower. Savings from a transition drop to 26%. They also have massive existing systems that still have useful life, union contracts that constrain operational changes, and political structures that make any infrastructure redesign a multi-decade project. For a city of a million people, this is a long conversation. Not an impossibility, but not where the first wave happens.
The sweet spot is the 50K-150K band. Big enough to finance a transition. Small enough that the politics are manageable and the decision-makers are close to the problem.
Here is the catch-22. The smallest utilities, the ones with the most to gain, are also the ones with the thinnest budgets and the least capacity to finance a transition. A 10,000-person district saving 47% sounds transformational on paper. In practice, that district has a five-person staff, a capital budget that barely covers emergencies, and a town council that has never approved anything that looks unfamiliar. The financial case is overwhelming. The institutional capacity to act on it is not.
The districts with the most capacity to execute a transition are the ones with the least financial incentive. The districts with the most financial incentive are the ones least equipped to pull it off. The middle band is where the math and the reality meet.
Then there are the places in true crisis. Jackson, Mississippi is the example everyone knows. A city where the water system failed so completely that residents went without running water. Where federal emergency declarations were issued over infrastructure that had been underfunded for decades. Jackson is not a small utility with a thin budget. It is a city of 150,000 people that has been pouring money into a failing underground system and watching it collapse anyway.
Places like Jackson need something different. Not another round of emergency pipe repairs. Not another federal grant that patches the same failing design. They need an inflection point. A reason to stop reinvesting in infrastructure that was failing before the last repair was finished. The distributed storage model is not the only answer. But it is the kind of radical rethinking that crisis creates the political space for. When the status quo has already failed, the barrier to trying something new drops considerably.
Why tanks are the better asset
There is a reason this argument keeps coming back to storage tanks. Tanks are the opposite of buried pipe in almost every way that matters for long term asset management.
A tank sits above ground. You can see it. You can walk up to it, put your hands on it, measure wall thickness, assess coating condition, and know exactly what you are dealing with. The maintenance is predictable. The failure modes are well understood. The costs are controllable.
Underground pipe is none of those things. You cannot see it. You cannot inspect it without excavation or expensive inline tools. You find out it's failing when the street floods or the water quality changes. The maintenance is reactive by default because you cannot observe the asset in its normal state.
Tanks also last. A well maintained steel water storage tank can operate for 50 to 100 years. The key phrase is "well maintained." When you can see the asset, when you can schedule coating work and corrosion mitigation based on actual condition data, the useful life extends dramatically. You are not guessing. You are managing. And the capital you put toward a tank in year one is still producing value in year 50. Try saying that about a pipe you buried in year one. By year 50 you are already planning its replacement.
That is the real argument for distributed storage. It is not just cheaper over the 30-year analysis window. It shifts the entire infrastructure portfolio from invisible, unmanageable assets to visible, manageable ones. And the assets you build have useful lives that extend well beyond the comparison period. The operating posture changes from reactive to proactive. The capital planning changes from guesswork to data.
Pipes went underground for a good reason. In Boston, the frost line sits four feet down. A pipe above that line freezes, expands, and ruptures. Below the frost line, it doesn't. That engineering decision made sense in 1870 and it makes sense today in cold climates.
What doesn't make sense is that we exported the same design to Phoenix. To Tampa. To Houston. Places where the ground never freezes. The engineering constraint disappeared but the assumption stayed. Nobody asked the question again. Partly convention. Partly the aesthetic preference of keeping infrastructure out of sight. Partly the belief that underground means protected, that burying a pipe keeps it safe from weather, vehicles, vandalism.
That last one is worth examining. A buried pipe is protected from surface hazards, yes. But it is also protected from you. You cannot see it, inspect it, or maintain it without digging it up. A steel storage tank sitting on a concrete pad is exposed to the elements. It is also exposed to your maintenance crew. You can coat it, monitor it, repair it, and extend its life indefinitely because you have access to it. The pipe trades visibility for protection. The tank trades protection for visibility. Over 30 years, visibility wins. The cost of the underground assumption is $459 million for a single mid-size district.
Geography plays into this in other ways too. Florida is flat. Gravity does not move water in Florida. The state already runs on pump stations and storage tanks because it has no choice. A distributed storage model is not a conceptual leap for a Florida utility. It's an extension of what they already do.
The Northeast is different. Elevation changes do real work in places like New England and the mid-Atlantic. Gravity-fed systems reduce pumping costs and simplify operations. The transition looks different there. It starts with the sprawling suburban districts that have flat service areas and long pipe runs, not the hillside towns where gravity is free infrastructure.
Someone in Minnesota is reading this and thinking: tanks freeze too. They are right. The inlet pipes freeze. The valve stems freeze. You solve that with heat tracing and insulation. Standard practice on every municipal tank north of the Mason-Dixon line. The bulk water in a 500,000 gallon tank has massive thermal inertia. Ice forms on the surface and walls but the volume stays liquid. The ice has room to expand upward. No pressure buildup. No rupture.
A pipe is the opposite geometry. High surface area to volume ratio. It loses heat fast. An ice plug forms and creates pressure between the plug and the nearest closed valve. The pipe ruptures. Not at the ice, but where pressure exceeds wall strength. A frozen tank fitting is a maintenance call. You can see it. You can fix it. A frozen water main is a flood. You cannot see it until the street caves in. One is a problem. The other is a crisis.
The distributed storage model does not eliminate winter challenges. It changes them from invisible catastrophic failures to visible manageable ones.
The financial case is strongest where the terrain is flat, the pipe network is long, and the existing system already depends on mechanical pressure. But even in cold climates, the maintainability argument holds. A tank you can see will always be easier to manage than a pipe you cannot.
At Clearwell, this is what we do. We build the technology that helps tanks live long, healthy lives. Condition monitoring, inspection intelligence, lifecycle planning. The work we do gets better when the assets are visible and the data is structured. A world with more above-ground storage is a world where infrastructure operators have real information about real assets, and can make decisions based on what they actually observe instead of what they hope is true underground.
What actually changed
We have been running a 150-year experiment on underground water distribution. We are now getting the results.
There are pipes in the ground that have only been replaced once in their entire service history. Mains installed in the 1970s have never been touched. For most of that time, we did not know what we did not know. The pipes were underground. They moved water. Nobody had the data to ask whether the system was working well or just working.
That changed. National-scale assessments forced the question. The EPA estimated $648 billion in water infrastructure needs. The ASCE gave drinking water infrastructure a C- grade. Utah State University found that 20% of water mains have exceeded their useful life, up from 8% in 2012. Leakage rates of 14-18% became common knowledge instead of dirty secrets. The data did not create the problem. It made the problem impossible to pretend away.
At the same time, something else shifted. Two cost curves started moving in opposite directions.
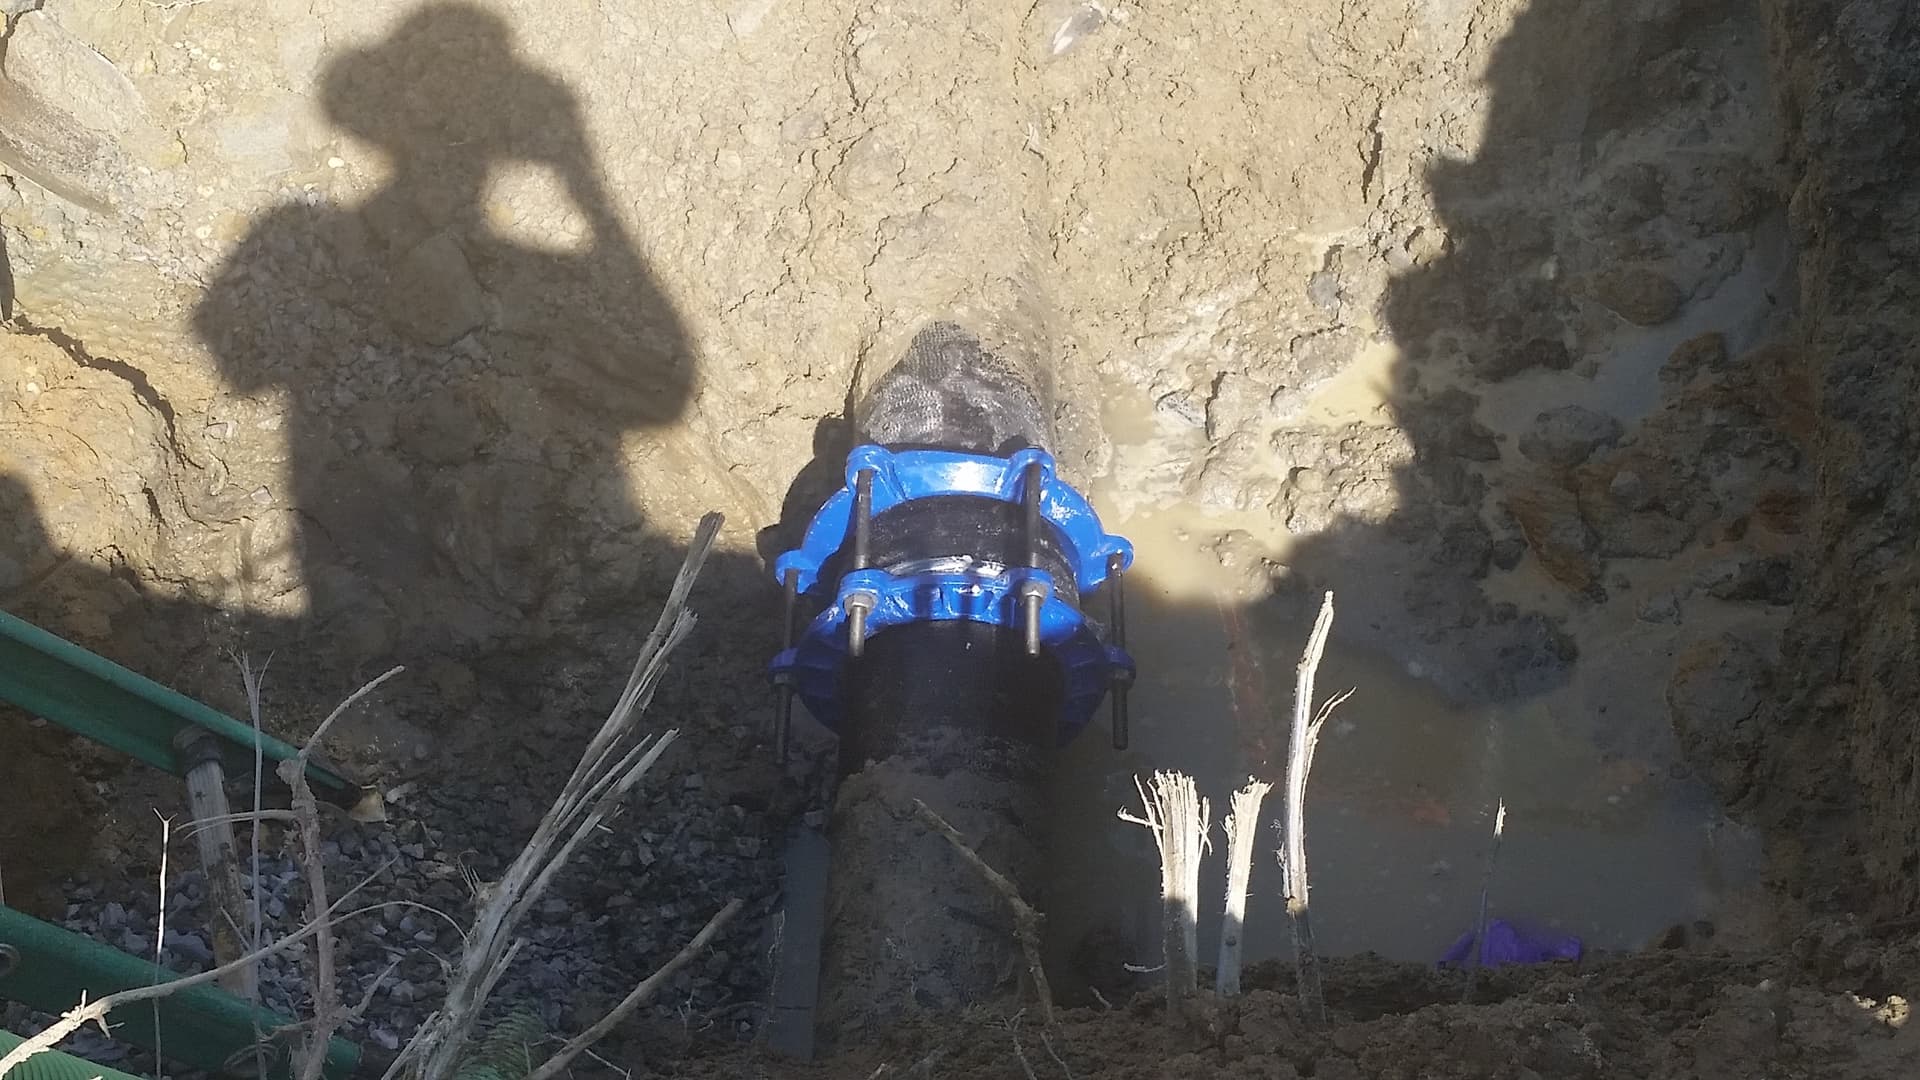
The cost of labor went up. Digging up a water main requires heavy equipment, a crew, traffic control, environmental compliance, surface restoration. Every year that gets more expensive. The skilled labor to do it gets harder to find. A single main break repair can cost $50,000 to $150,000 depending on depth, diameter, and location. That number only moves in one direction.
The cost of maintaining above-ground assets went down. And it is still going down.
The vision that is already becoming reality looks like this. A truck pulls up to a tank site carrying a drone and an ROV. The drone flies the exterior autonomously, capturing high-resolution imagery of every square foot of coating, every weld seam, every piece of structural steel. The ROV enters the tank and floats the interior, mapping wall thickness, identifying corrosion pitting, and flagging micro-defects that a human inspector would miss or take days to find. The data uploads to a platform that runs automated condition assessment, builds a 3D model of the asset, and generates a maintenance plan. One mobilization. One crew. Multiple assets in a day.
That is not science fiction. Operators are running distributed inspection models like this today. The technology for autonomous exterior flight and interior floating already exists. AI-powered defect identification can catch corrosion patterns at a resolution that manual inspection cannot match. Predictive corrosion modeling can tell you which tanks need coating work next year and which ones can wait another five. If you want to see what a fully modeled tank looks like, visit our 3D tank experience.
The trend is clear. Every year, the per-asset cost of above-ground inspection and maintenance drops. Every year, the per-mile cost of underground pipe work goes up.
That is the divergence. Underground maintenance is getting more expensive because it is fundamentally a labor and excavation problem. Above-ground maintenance is getting cheaper because it is fundamentally an information and access problem. Labor costs compound. Technology costs decline. The longer you wait, the wider the gap gets.
A district with 3 tanks could always justify manual inspection. A district with 15 could not. That math changed. A utility can now manage 15 tanks for what it used to cost to manage 5. That is the flip point that makes distributed storage economics work.
The question nobody's asking
For decades, the water industry has debated how to fund the replacement of underground pipe. How to close the gap. How to raise rates. How to get federal dollars.
Nobody's asking whether underground pipe should remain the default unit of distribution.
The assumptions we've been building on aren't centuries old. They're decades old. The designs that govern how water moves from treatment to tap were locked in during the post-war infrastructure boom. They predate microgrids. They predate the entire modern understanding of networked, distributed systems.
The pipe network made sense when it was the only tool we had. It doesn't have to be the only tool we use.
The districts that figure this out first will spend less, maintain more, and build infrastructure that is still producing value decades after the analysis window closes. The rest will keep pouring money into the ground.
Get the financial model
We built the full financial model behind this analysis. Editable assumptions, 30-year lifecycle projections across four utility sizes, and leakage cost analysis.
Download the editable financial model
All assumptions, 30-year lifecycle projections, and leakage analysis in one spreadsheet. Edit the blue-text inputs and the formulas recalculate automatically.
Andy is the founder of Clearwell AI, building AI-powered technology for the bulk storage tank inspection industry. Clearwell's thesis: AI adoption fails at the business process layer, not the technology layer. The companies that structure domain knowledge for AI, not the ones that train models, will own the next decade of industrial technology.